About Us

Welcome to
Market Spotter

Bringing you the power of precision in market analysis!

We have streamlined market analysis to enhance your trading journey. Say goodbye to cluttered charts – with us you’ll experience a symphony of simplicity.
Our Indicators

Signal Dynamics Pro

Signal Dynamics Pro provides a diverse set of signal options and dynamic features suitable for various markets. Its main features are real-time support and resistance bands, trendline and range projections with signals. This multifaceted functionality offers valuable insights for traders of all levels.

Market Structure Concepts Pro

Market Structure Concepts Pro is an all encompassing indicator that provides valuable insights to analyze market trends, liquidity zones and fundamental market structure. It can also identify fair value gaps, premium and discount zones.

RSI Rocket

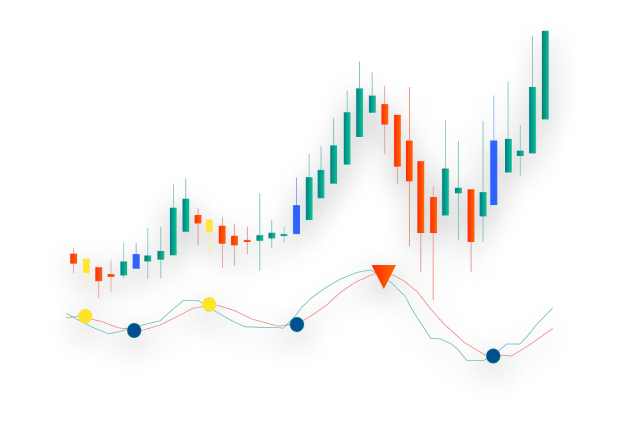
RSI Rocket is a sequence of momentum-based Indicators that aim to take advantage of market trends, pivot points whilst signaling unbiased entry and exit opportunities.

Turbo Trend

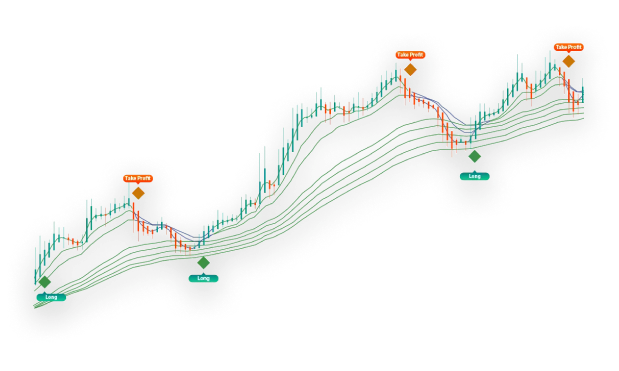
Turbo Trend is an accumulation of moving averages that visually identifies the trend direction of the market, whilst dynamically displaying unbiased entry and exit opportunities.

Support Shield

Support Shield identifies ongoing Support and Resistance zones. This Indicator demonstrates the depth of the levels of Support or Resistance, and the percentage between these zones.

Cloud Catcher

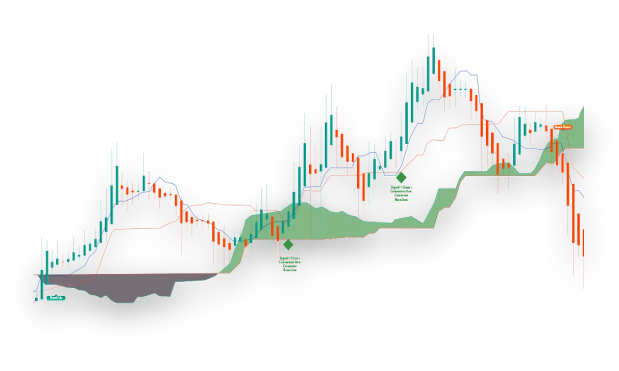
Cloud Catcher utilizes the Ichimoku Cloud indicator to provide trend confirmation, support and resistance and market sentiment. This indicator also provides unbiased entry and exit opportunities.

Signal Sniper

Signal Sniper utilizes real time data and price action to provide fast entry and exit opportunities, ideal for scalping on lower timeframes. This indicator has additional options to confirm trends and provide trading ranges.

MACD Pulse

MACD Pulse identifies pivot points in the market which can indicate a change in momentum and trend direction. It provides unbiased entry and exit opportunities.

Volatility Vortex

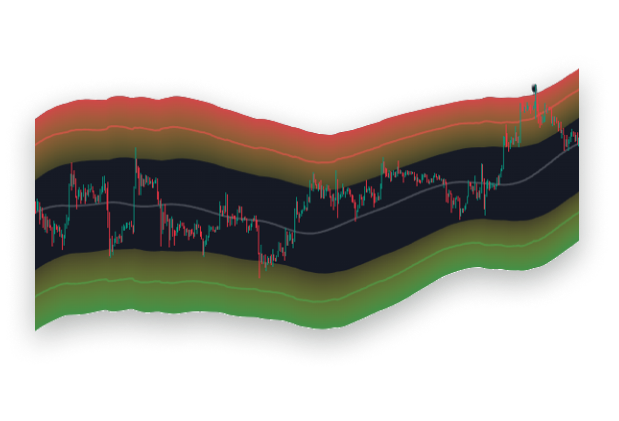
Volatility Vortex is derived from the Mean Reversion Theory, where price has a tendency to revert to its mean. This indicator also demonstrates points of dynamic Support or Resistance within the Volatility Vortex channel.
Momentum Matrix

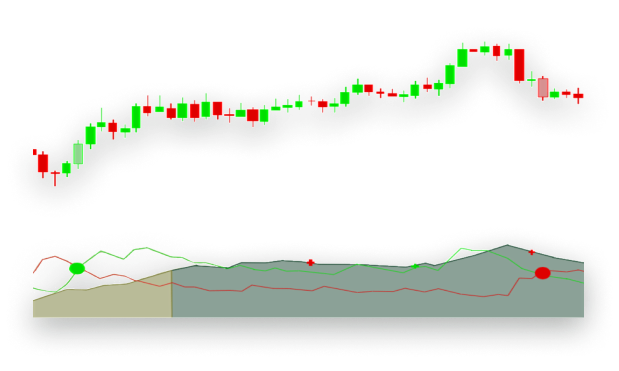
Momentum Matrix measures the strength and direction of any market trend, whilst providing insights on future changes of the strength of the trend.

Master Trend

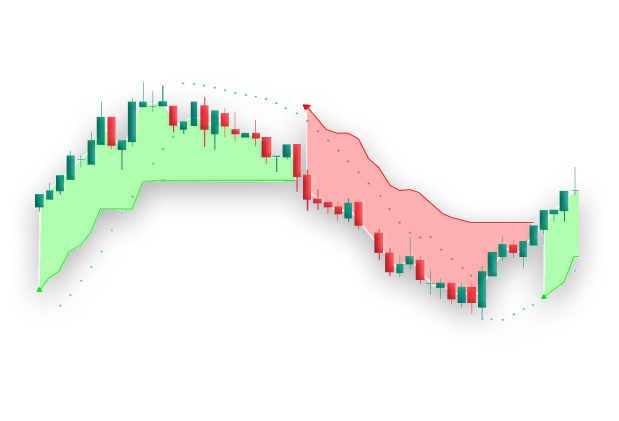
Master Trend highlights the current market trend whilst providing unbiased entry and exit opportunities. Never miss another opportunity with additional features for setting your perfect stop-loss and spotting trend reversals.

Target Chaser

Target Chaser is a useful tool which will visually display your trade on the chart based on a few inputs. It automatically calculates important information in real time such as the trade’s P&L, Position Size and Risk/Reward Ratio.

Support and Resistance Levels

This advanced indicator assists in identifying important support and resistance levels, as well as higher highs and lower lows, which combined provide valuable insight into market movement.

Bollinger Band RSI

This indicator serves as an innovative tool with the purpose of measuring volatility, identifying trends, and signaling potential market reversals. Its unique attributes include offering enhanced insights into overbought and oversold conditions, price convergence, and volatility measurements. This amalgamation provides valuable observations into how prices behave in relation to the two bands and oversold/overbought conditions.

Moving Average Bands

Crafted as a tool to aid traders, this indicator helps identify trends, support and resistance levels, and price reversals. Its unique feature lies in determining trend direction and dynamic support and resistance through the amalgamation of Moving Averages. This combination provides valuable insights for recognizing and confirming trends, dynamic support and resistance, and filtering out the noise in price movements