Market Spotter
Indicator Guide
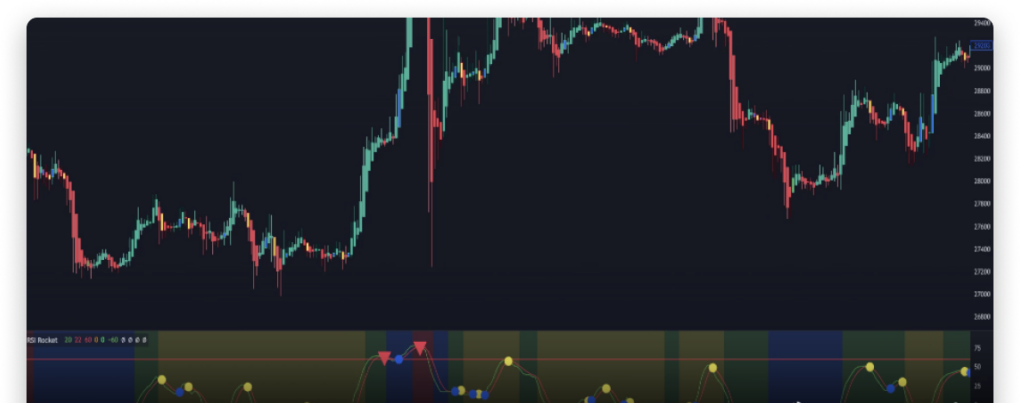
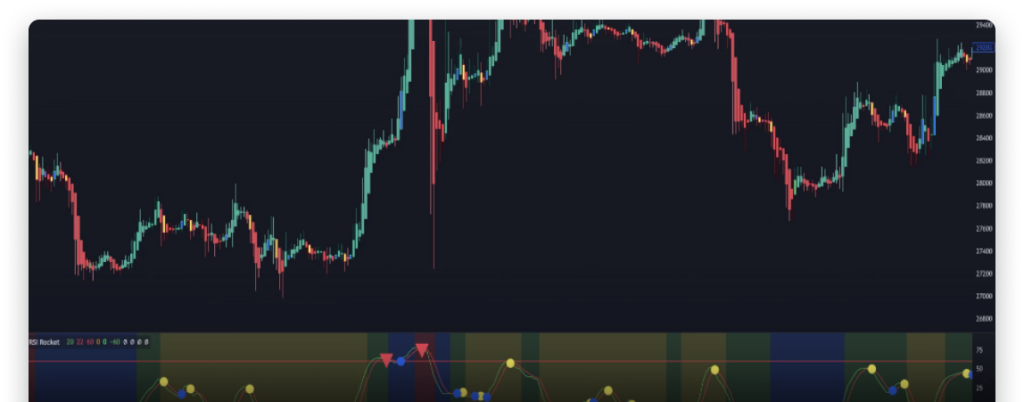
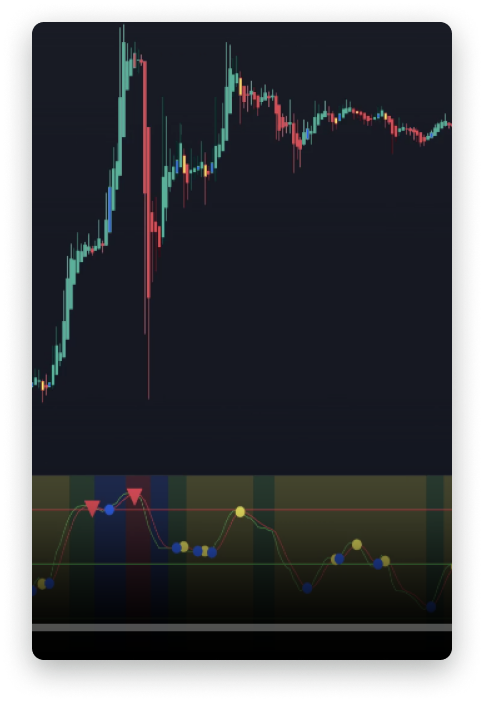
RSI Rocket
Momentum Indicator
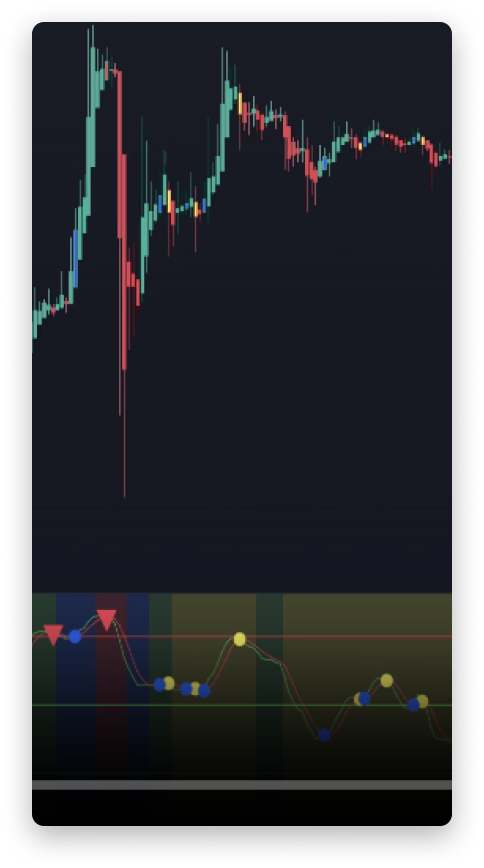
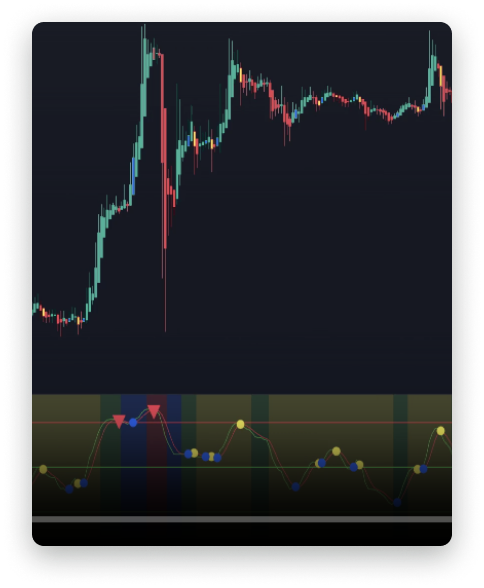
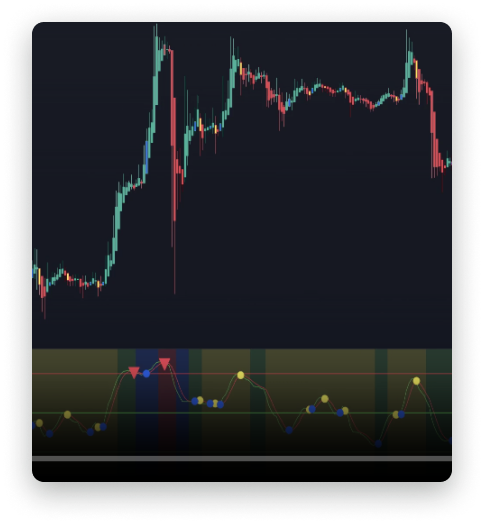
RSI Rocket is a momentum-based indicator that measures the strength of the price trend and identifies potential trend reversals.
Red Triangle - Strong Sell
Identifies a strong potential pivot to the downside in the market and a potential sell/short opportunity.
Green Triangle - Strong Buy
Identifies a strong potential pivot to the upside in the market and a potential buy/long opportunity.
Yellow Circle - Weak Sell
Identifies a weaker potential pivot to the downside in the market and a potential sell/short opportunity.
Blue Circle - Weak Buy
Identifies a weaker potential pivot to the upside in the market and also gives an opportunity to enter a buy/long position.
Turbo Trend
Green Diamond - Long
These will appear when the ribbon turns green and the price finds support above it. They signal a potential uptrend and a potential long position opportunity (buy).
Trend Indicator
Turbo Trend is a moving average-based indicator that identifies the direction the market is trending on all timeframes.
Blue Diamond - Take Profit Short
Red Diamond - Short
These will appear when the ribbon turns red and the price finds resistance below it. They signal a potential downtrend and a potential short position opportunity (sell).
Orange Diamond - Take Profit Long
They indicate that the bullish trend might be over and a good point to take profits from your long position.
Support Shield
Blue rectangle
This indicates a support area. The bigger the area, the stronger the support. It may be used to enter long positions (buy) when the price is close to or inside a support area.
Tip
Long/Buy signals from one of our other indicators that appear close to or inside a support area from Support Shield have a higher success rate. Likewise, Sell/Short signals will be more effective if they appear close to or inside a resistance area.
Red rectangle
This indicates a resistance area. The bigger the area, the stronger the resistance. It may be used to enter short positions (sell) when the price is close to or inside a resistance area.
Support & Resistance
Cloud Catcher
Cloud Catcher
Cloud Catcher is an Ichimoku Cloud based indicator that can help identify trend direction, strength, market sentiment and support/resistance.
Break Down
The price has broken below a green cloud (area of support). This may indicate a trend reversal and represent an opportunity to enter a short position or close any previous longs.
Conversion Line Crossing Up Through Base Line
Base Line Crossing Over Conversion Line
Break Up
The price has broken above a red cloud (area of resistance). This may indicate a trend reversal and represent an opportunity to enter a long position.
Signal Sniper
Long
Indicates a potential uptrend and an opportunity to buy or enter a long position.
Tip
For all signals on Signal Sniper to be confirmed, the candle in which the signal appears needs to close. Sometimes the signal will appear with a fresh candle and then disappear before the candle closes as conditions may change. Take into consideration that the price may move considerably before candle closure.
Scalping Indicator
Using a combination of different trend and momentum-based indicators, it provides long and short opportunities for all types of trading.
Short
These will appear when the ribbon turns red and the price finds resistance below it. They signal a potential downtrend and a potential short position opportunity (sell).
Zero Lag Moving Average
The white line represents a 50 period zero lag moving average. You can exit your long positions when the price crosses down through the line or when you get a “Short” signal. You can also exit a short position when the price crosses up through the line or when a “Long” signal appears.
MACD Pulse
Green Triangle
Indicates a bullish cross of the MACD Line above the Signal Line. This is a buying opportunity.
Green Cross
BD (Green)
Trend & Momentum Indicator
MACD Pulse uses the Moving Average Convergence Divergence indicator to find hidden patterns in price action, signaling potential pivots, trend reversals and divergences and providing customizable buy and sell signals
Red rectangle
Red Cross
BD (Red)