Market Spotter is a set of powerful trading indicators that is gives users that extra edge when performing technical analysis. These indicators operate in volatile markets, and as we know cryptocurrency is volatile. The increasing popularity and adoption of cryptocurrencies has given rise to a new wave of traders, and ways to trade. Retail traders can simply buy and hold, trade both directions of the market and/or take advantage of trading bots. Market Spotter is a useful set of trading indicators and can be used to analyse ongoing uncertainties of markets.
Wedges are technical trading patterns that usually indicate a reversal in price, this will largely depend on the type of wedge that is formed. A wedge is identified by price fluctuations within that pattern. In other words, price moves between support and resistance levels of a pattern until a breakout occurs. This breakout usually happens towards the end of the pattern, also known as the “Apex”. This is because the price becomes squeezed towards the end of this particular pattern, thus giving rise to a breakout.

A rising wedge is typically a bearish pattern indicating that the price is likely to reverse to the downside upon a breakout. This pattern is formed with price forming an upwards resistance line with price forming higher highs and with an upwards support slope by price forming consistent higher lows. A breakout in price often occurs when the price is reaching the apex of the pattern and for this case, towards the downside.

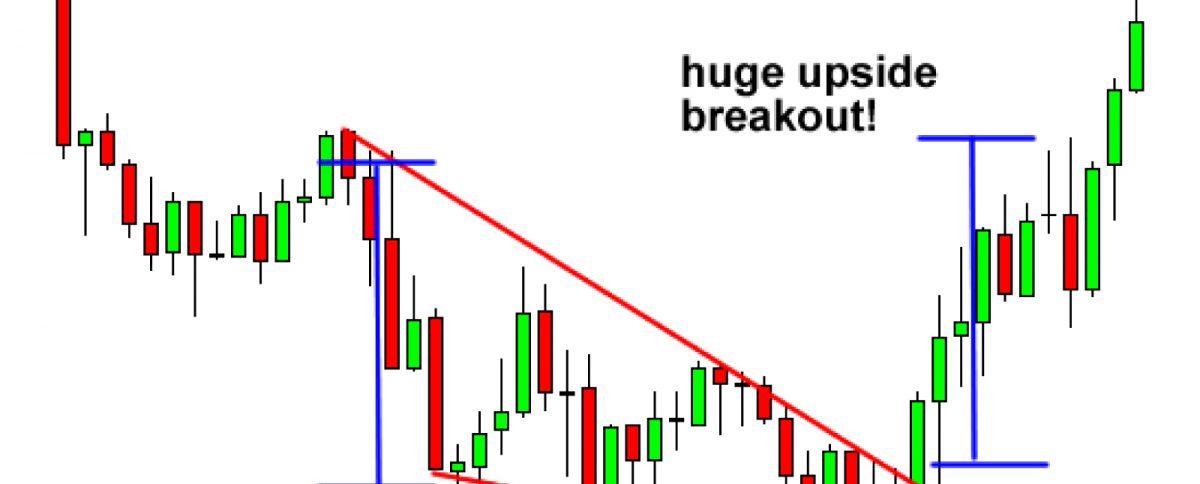
A falling wedge is considered as a bullish reversal pattern that indicates that the price is likely to reverse to the upside upon a breakout. This pattern is formed with price forming a downwards resistance line created by lower highs and with a downwards support line formed by continuous lower lows. The breakout of this technical pattern typically occurs to the upside which happens near the apex
As the cryptocurrency market has been in a downtrend after Bitcoin touched the 48000$ mark at the end of march, many analysts have been noticing a potential reversal pattern for Bitcoin. The number one cryptocurrency has been forming a falling wedge and is currently reaching its apex. Analysts are expecting a breakout to occur soon and many hope that it will be to the upside. This is where Market Spotter becomes handy, and traders are waiting for signals to ride the next volatile move.